
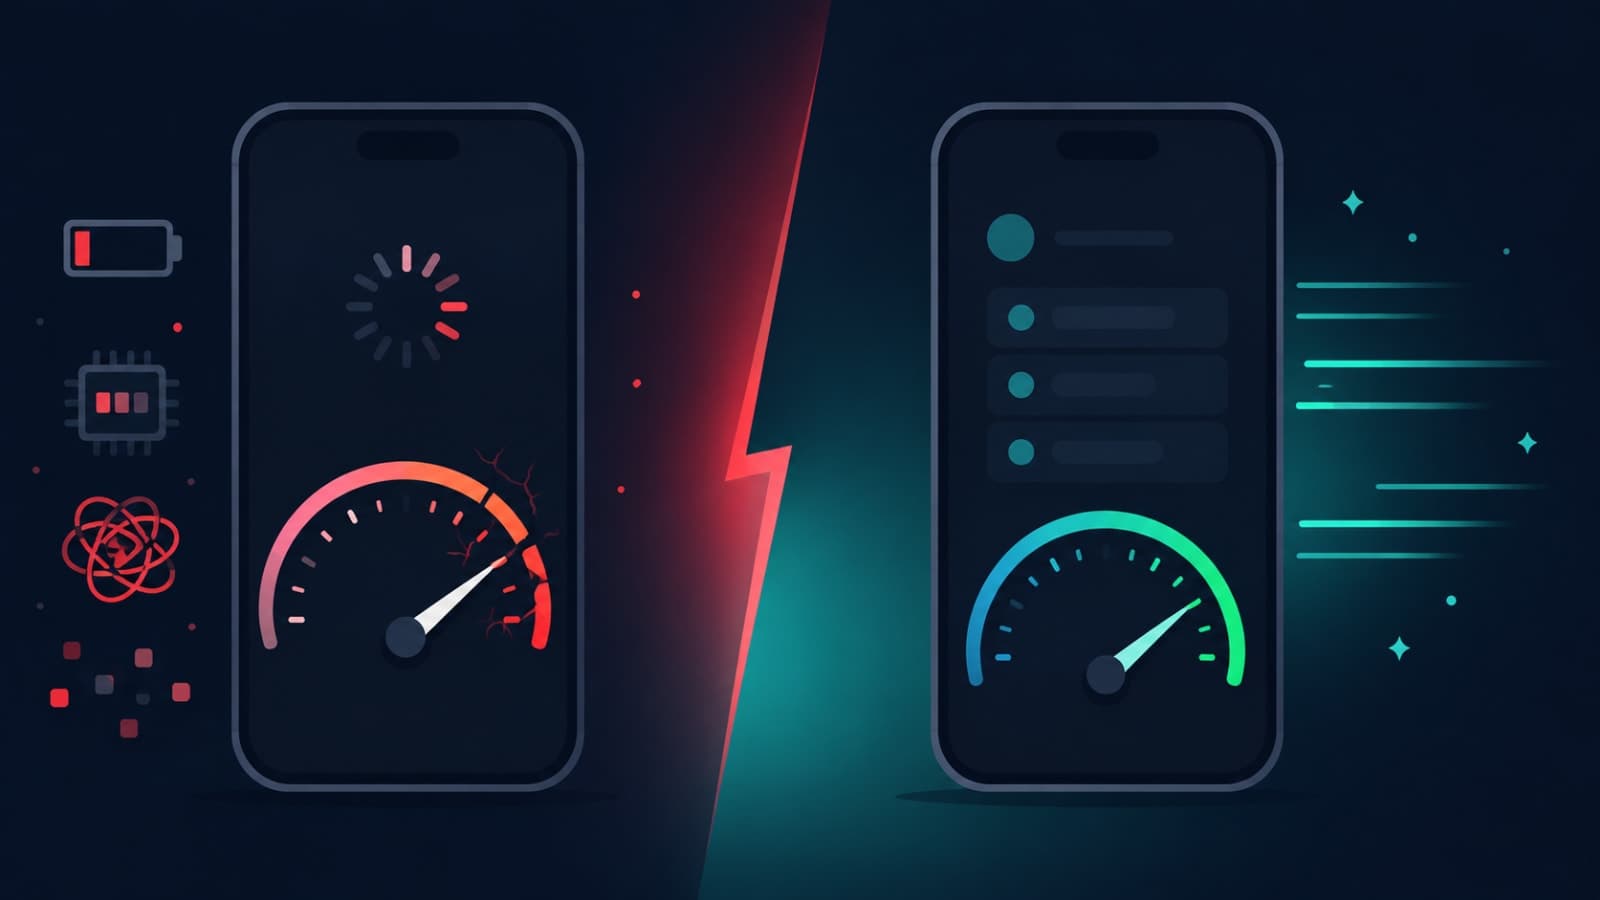
"The app feels slow" is one of the vaguest bug reports a team can get, and also one of the most expensive to ignore — sluggish apps see higher uninstall rates and worse reviews than almost any other complaint. The good news is that "slow" almost always breaks down into a handful of specific, fixable causes: unnecessary widget rebuilds, unmanaged memory, a bloated startup path, and resources loaded before they're needed. This guide walks through each one — how to actually diagnose it, not just guess — with a focus on Flutter, since that's the stack behind most of the apps we ship.
Diagnose Before You Optimize
Every optimization below starts the same way: measure first. Guessing which part of the app is slow and "optimizing" it blind wastes engineering time and sometimes makes things worse.
- Always profile in Profile Mode on a physical device — debug mode performance is meaningfully slower than a release build and will point you at problems that don't actually exist in production.
- Flutter DevTools' Performance tab shows frame rendering times directly — anything consistently over 16ms (60fps) or 8ms (120fps on newer devices) is dropping frames the user will notice as jank.
- Enable "Track Widget Rebuilds" in the widget inspector to see exactly which widgets flash on every state change — that visual signal is usually the fastest way to spot rebuild waste.
- Take memory heap snapshots at app start, after normal use, and after a long session — a heap that keeps growing without dropping back down after garbage collection is a leak, not just "heavy usage."
Widget Rebuilds: The #1 Cause of Jank
Every call to setState() rebuilds that widget and everything beneath it in the tree. In a small widget that's free. In a large screen with deeply nested children, it's the most common reason a Flutter app drops frames — the rebuild logic just isn't scoped tightly enough.
- Use
constconstructors everywhere the widget's properties never change — Flutter builds const widgets once at compile time and skips rebuilding them entirely. Enable theprefer_const_constructorslint rule so missed opportunities get flagged automatically instead of found by accident. - Scope state to the smallest widget that actually needs it — extract the part of the screen that changes into its own
StatefulWidgetinstead of callingsetState()on a parent that rebuilds the whole screen for a one-line update. - Use
ConsumerorSelectorwith Provider/Riverpod to rebuild only the specific widget subscribed to a piece of state, not everything downstream of the provider. - Wrap animated widgets in a
RepaintBoundaryso an animation repainting every frame doesn't force its siblings to repaint along with it. - Use
ListView.builderandGridView.builder, never a plainListViewwith all children built upfront — the builder constructors only instantiate what's visible in the viewport, which matters enormously once a list has more than a screen's worth of items.
Memory Leaks: The Slowdown That Creeps In Over Time
An app that's fast right after launch but gets sluggish the longer it stays open almost always has a memory leak — something is being created and never released. These are quiet bugs: nothing crashes immediately, the app just gets slower and eventually the OS kills it for using too much memory.
- Always dispose controllers and subscriptions —
AnimationController,TextEditingController,StreamSubscription, and Firebase listeners all need an explicitdispose()call, or they keep running (and holding memory) long after the widget that created them is gone. - Cancel streams before closing them — a common pattern that gets missed is calling
.close()on aStreamControllerwithout first canceling an activeStreamSubscriptionlistening to it. - Move heavy computation off the main thread — JSON parsing of large payloads, decryption, and image processing all belong in
compute()so they run on a separate isolate instead of blocking frame rendering. - Watch image memory specifically — loading a full-resolution image into a thumbnail-sized widget without resizing it first is one of the most common sources of avoidable memory pressure, especially in image-heavy feeds and galleries.
Startup Time: What Happens Before the User Sees Anything
Cold start — the time between tapping the icon and seeing a usable screen — is measured in seconds users actually notice, and it's almost entirely a function of how much work your app does before rendering the first frame.
- Keep the launch layer thin. The first screen should build the minimum widget tree needed to be usable, not the full app shell with every dependency wired in.
- Move database initialization, heavy network calls, and analytics setup out of
main(). None of these need to block the first frame — initialize them after the UI is already visible and interactive. - Fetch startup data asynchronously with
FutureBuilderorStreamBuilderrather than awaiting it before the app even renders — show a lightweight loading state instead of a blank screen while the real data arrives. - Lazy-initialize SDKs — crash reporting, analytics, and any third-party SDK that isn't needed for the very first screen can be initialized in the background after first frame, not synchronously during launch.
Lazy Loading and Caching: Doing Less Work, Later
Lazy loading and caching solve two different problems that often get conflated: lazy loading means not fetching or building something until it's actually needed; caching means not fetching or building the same thing twice. A well-optimized app needs both.
- Route-based lazy loading — generate routes on demand rather than importing and instantiating every screen widget at app startup, so screens the user never visits never cost anything.
- Deferred imports for large, non-critical features — Dart's
deferred asimport syntax loads a library only when explicitly requested vialoadLibrary(), which can meaningfully cut startup code size for features like ML models or rarely-used admin dashboards. - Cache network images instead of re-downloading them on every screen visit — this is one of the highest-leverage, lowest-effort fixes for apps with image-heavy feeds.
- Cache API responses for data that doesn't change every request, reducing both network calls and the perceived wait time on repeat visits to the same screen.
- Paginate large datasets instead of fetching everything up front — combined with
ListView.builder, this keeps both the network payload and the widget tree proportional to what the user can actually see.
A fast app isn't one big optimization — it's dozens of small ones that stop doing work the user doesn't need done yet.
Common Mistakes That Undo All of the Above
- Profiling in debug mode and chasing performance numbers that don't reflect what a real user on a release build actually experiences.
- Rebuilding an entire screen for a small state change because state lives too high up the widget tree instead of being scoped to where it's actually used.
- Loading full-resolution images into small widgets without resizing, quietly inflating memory usage across every screen that shows them.
- Treating heavy visual effects — blurs, shadows, complex gradients — as free, when they're often the specific cause of jank on mid-range devices even if the rest of the app is well optimized.
- Skipping regression testing for performance — a screen that was fast at launch can quietly regress as features get added, and without automated performance checks in CI, nobody notices until users complain.
How We Approach Performance at Fall Rise
Performance isn't a pass we do at the end of a build — it's a set of architectural decisions made from the first sprint, in how state is scoped, how lists are rendered, and what actually runs before the first frame. That discipline is baked into every mobile app development engagement we take on, paired with a backend API designed to support pagination and caching from day one rather than returning everything in one oversized response. For products like Bhaada and RentEra — you can see both in our project portfolio — keeping list screens and image-heavy feeds fast under real usage was a deliberate architectural priority, not an afterthought fixed post-launch. If your app is already live and starting to feel sluggish as features pile on, that's exactly the kind of audit we do as part of custom software development work — profiling first, then fixing what the data actually points to.
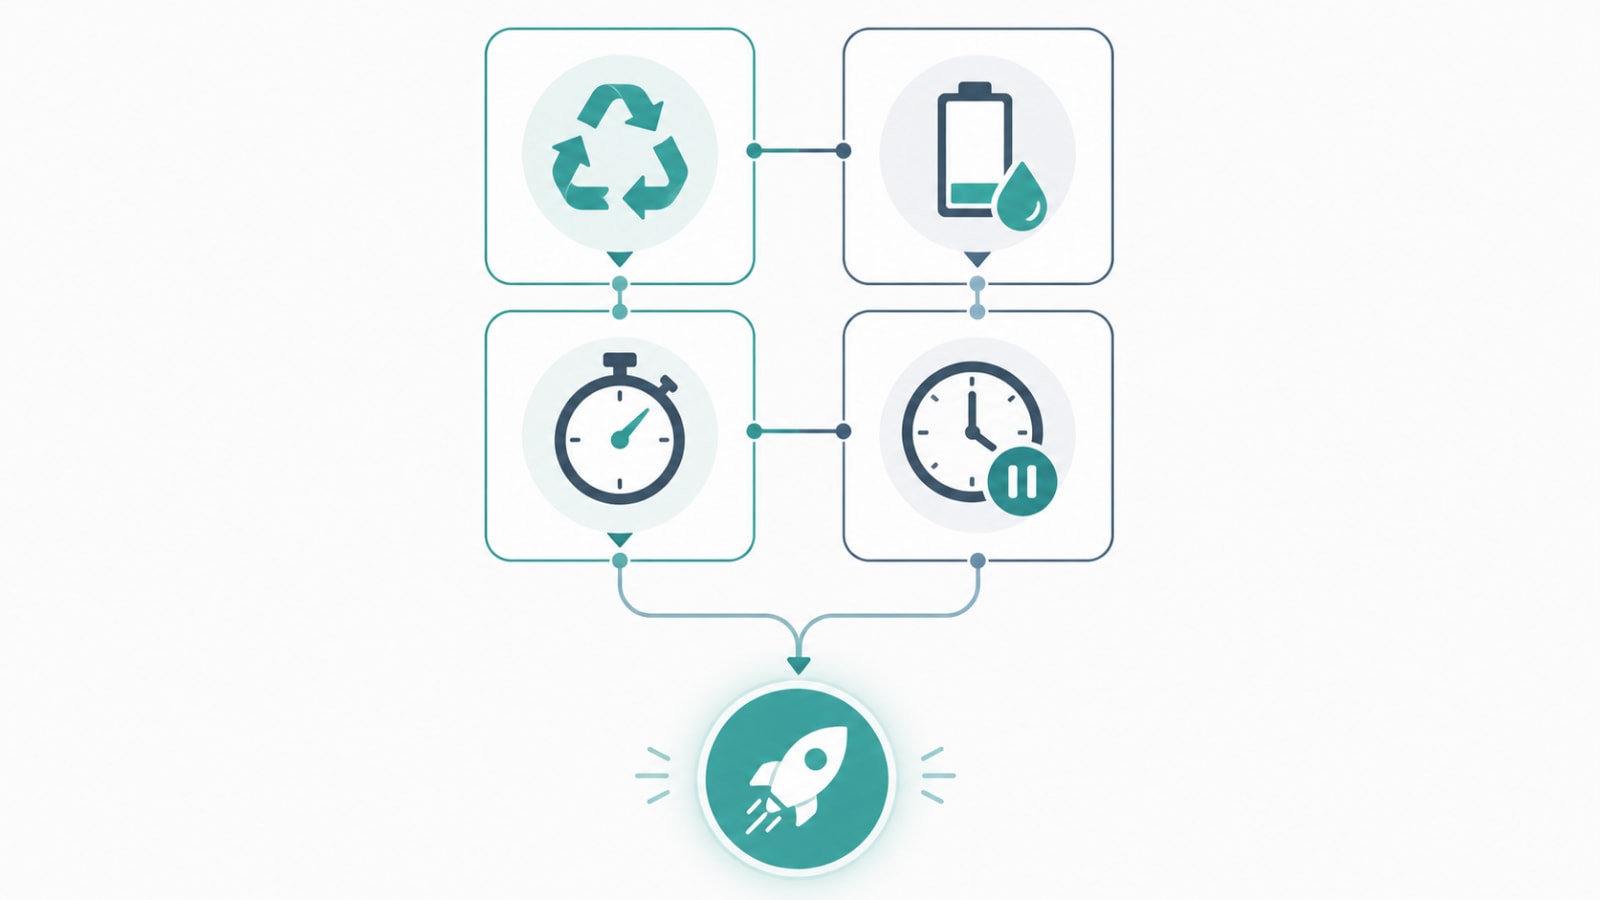
"The app feels slow" is rarely one bug — it's usually several small, specific issues that compound. Profile first, fix widget rebuilds and memory leaks, trim what runs at startup, and load the rest only when it's actually needed. If your app has grown past the point where that audit is easy to do in-house, let's talk — a focused performance pass is usually far faster and cheaper than the rewrite it feels like you need.